Welcome back, readers! Today, we delve into the fascinating world of Prometheus, a powerful open-source system for monitoring services and alerts.🚀
Prometheus is designed to collect data and metrics from various services and store them based on a unique identifier, the metric name, and a time stamp. This flexible architecture allows Prometheus to provide real-time insights and analysis for system monitoring and troubleshooting. Let's explore the key aspects of Prometheus and understand why it has gained significant popularity among developers and system administrators. 😊
# What is the Architecture of Prometheus Monitoring? 🏛️

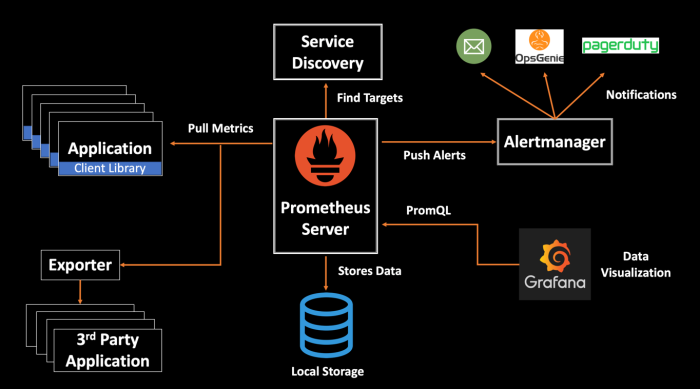
Prometheus follows a highly scalable and robust architecture that enables efficient data collection, processing, and storage. At its core, Prometheus consists of three main components:
Prometheus Server: The heart of the system, the Prometheus server is responsible for data collection and storage. It regularly scrapes metrics from configured targets using HTTP-based pull mechanisms. Once collected, the metrics are stored in a time series database for further analysis and querying.
Metrics and Exporters: Prometheus adopts a "pull" model, where exporters are employed to expose application-specific metrics in a format that Prometheus understands. These exporters are usually integrated within the applications themselves or run as separate processes. Prometheus can pull metrics from these exporters at predefined intervals.
Alertmanager: The Alertmanager component handles alerting and notification management. It receives alerts from the Prometheus server and applies user-defined rules to determine when and how to send notifications. This flexible alerting system allows administrators to stay informed about critical events and take appropriate actions promptly.
For more information click here
#What are the Features of Prometheus? 🌟
Prometheus offers a rich set of features that make it an exceptional choice for monitoring and alerting:
Powerful Query Language: Prometheus provides a flexible query language called PromQL (Prometheus Query Language) that allows users to extract and analyze data from the time series database. PromQL supports a wide range of functions and operators, empowering users to perform complex queries and gain valuable insights.
Dynamic Service Discovery: Prometheus supports automatic service discovery, which means it can identify and monitor new services as they are added to the infrastructure. This feature significantly simplifies the monitoring setup, especially in dynamic and containerized environments.
Scalability: Prometheus is highly scalable and can handle large volumes of data and high-velocity metrics. It achieves scalability by employing a distributed architecture where multiple Prometheus servers can be deployed and configured in a federated setup.
Visualization and Alerting: Prometheus integrates well with popular visualization tools like Grafana, enabling users to create insightful dashboards and charts. Additionally, the Alertmanager provides a flexible and configurable system for creating and managing alerts, ensuring that important events are promptly communicated to the relevant stakeholders.
#What are the Components of Prometheus? 🧩
Prometheus comprises several essential components that work together to provide its monitoring capabilities:
Prometheus Server: As mentioned earlier, this component is responsible for data collection and storage. It provides a web interface for querying metrics and retrieving relevant information.
Exporters: Exporters are small programs or libraries that help expose metrics in a format that Prometheus can understand. There are a wide variety of exporters available, covering popular software and systems such as databases, web servers, message queues, and more.
Pushgateway: The Pushgateway allows pushing batch jobs or service-level metrics to Prometheus instead of using the standard pull-based mechanism. It is useful in scenarios where metrics need to be collected from short-lived or batch jobs.
Alertmanager: This component handles the management of alerts and notifications. It receives alerts from the Prometheus server and can be configured to send notifications via various channels such as email, Slack, PagerDuty and more.
#What database is used by Prometheus? 🗄️
Prometheus utilizes its custom-built time series database for storing metrics. This database is optimized for high write throughput and efficient querying. By default, Prometheus stores its data on disk, but it also offers integrations with remote storage systems like long-term storage or data warehouses for extended data retention.
#What is the default data retention period in Prometheus? ⏳
By default, Prometheus retains data for 15 days. However, this period can be customized according to the specific requirements of your monitoring setup. It's important to strike a balance between data retention and storage resources to ensure optimal performance and efficient resource utilization.
And there you have it—Prometheus, the powerful open-source monitoring system! 🎉 Its flexible architecture, extensive features, and scalable nature make it a valuable tool in the realm of system monitoring and alerting. Remember to explore the vast ecosystem of exporters and integrations available to extend Prometheus' capabilities and enhance your monitoring infrastructure. 🔍
Stay tuned for more exciting topics, and don't forget to stay curious and keep learning! 🌈✨
